ASUS Gives You Nothing — So I Built My Own Prometheus Exporter
ASUS ships no API, no SNMP, no metrics endpoint. I SSH into the routers on every scrape cycle and pull it all myself — proc files, wl commands, and hidden SQLite databases — into Prometheus and Grafana.
ASUS ships the ZenWiFi XT9 with a slick app and zero observability. No API. No SNMP. No local metrics endpoint. If you want to know whether your mesh backhaul is healthy, how many clients are connected, or whether the WAN link is saturated — you open the app and squint at a bar graph.
That was enough motivation. This post walks through asuszenwifixt9-monitoring, a Python Prometheus exporter that SSHs into the router and its extenders on every scrape cycle and pulls ~40 metrics into Grafana.
Why This Exporter Exists
The ZenWiFi XT9 runs a Linux-based firmware with BusyBox. That means /proc is there, /sys is there, and a handful of ASUS-specific utilities like wl (Broadcom WiFi CLI) are available over SSH. It also means there are SQLite databases on the filesystem that the router's own app uses for client association data and traffic analysis.
No official API exposes any of this. So the exporter reads it directly.
What SSH Actually Gets You
On every Prometheus scrape, the exporter opens SSH connections to the router and each extender, then fires batched commands:
System batch (router + extenders):
cat /proc/loadavg— load averages (1m, 5m, 15m)cat /proc/uptime— uptime in secondscat /proc/meminfo— memory usage (MemTotal, MemFree, Buffers, Cached)cat /sys/class/thermal/thermal_zone0/temp— CPU temperature in millidegreescat /proc/stat— raw CPU tick counters for utilisation calculation
Wired network batch (router only):
cat /proc/net/dev— per-interface RX/TX bytes, packets, errors, drops for WAN (eth0), LAN bridge (br0), and backhaul interfaces
WiFi batch — per radio, per interface (eth4 = 2.4 GHz, eth5 = 5 GHz, eth6 = 5 GHz-2):
wl -i ethN assoclist— associated client MACswl -i ethN bs_data— per-client throughput and RSSI from the Broadcom driverwl -i ethN chanim_stats— channel interference / utilisation
All commands in a batch are concatenated with ; and sent in a single SSH exec_command call, so each scrape only opens a handful of connections regardless of how many metrics are collected.
The SQLite Secret Sauce
The real client-level data lives in three SQLite databases on the router filesystem, queried over SSH via sqlite3:
- stainfo.db — Wi-Fi station info: RSSI, TX/RX rate, connected time per client MAC
- wifi_detect.db — Roaming event log: which extender/band a client last associated with, and when
- TrafficAnalyzer.db — Per-client bandwidth totals (today, this week, this month)
The queries are sent as shell one-liners: sqlite3 /jffs/nmp_cl/xxx.db "SELECT ...". The output is tab-separated, parsed in Python, and mapped to Prometheus gauge labels by MAC address.
Architecture
The exporter runs as a single Python process. Prometheus scrapes it on port 8000. On each scrape, the AsusCollector class fires SSH command batches in sequence (router system → router wired → router WiFi DBs → extender system) and yields all metrics back to the Prometheus client library.
Prometheus
    │  scrape :8000
    ▼
AsusCollector (Python)
    ├── SSH → Router (192.168.50.1)
    │       ├── /proc/loadavg, /proc/stat, /proc/meminfo
    │       ├── /proc/net/dev
    │       ├── wl bs_data / assoclist / chanim_stats (per radio)
    │       └── sqlite3 stainfo.db / wifi_detect.db / TrafficAnalyzer.db
    └── SSH → Extender (192.168.50.x)
            ├── /proc/loadavg, /proc/stat, /proc/meminfo
            └── wl bs_data / assoclist / chanim_stats (per radio)
SSH connections are managed by a SSHClient wrapper around Paramiko with automatic reconnect. If a command fails, it retries once before surfacing the error.
Metrics Reference
| Metric | Type | Labels | Description |
|---|---|---|---|
asus_load_average | Gauge | host, interval | Load average (1m/5m/15m) |
asus_uptime_seconds | Gauge | host | System uptime |
asus_memory_* | Gauge | host | MemTotal, MemFree, Buffers, Cached (bytes) |
asus_temperature_celsius | Gauge | host | CPU temperature |
asus_cpu_usage_percent | Gauge | host, mode | CPU time by mode (user/system/idle/…) |
asus_network_receive_bytes_total | Counter | host, interface | Interface RX bytes |
asus_network_transmit_bytes_total | Counter | host, interface | Interface TX bytes |
asus_network_receive_errors_total | Counter | host, interface | Interface RX errors |
asus_wifi_clients_total | Gauge | host, interface, band | Associated client count per radio |
asus_wifi_client_rssi_dbm | Gauge | host, interface, mac | Client signal strength (dBm) |
asus_wifi_client_tx_rate_mbps | Gauge | host, interface, mac | Client TX PHY rate (Mbps) |
asus_wifi_channel_utilization_percent | Gauge | host, interface | Channel busy time % |
asus_client_traffic_bytes_total | Counter | host, mac, direction, period | Per-client traffic from TrafficAnalyzer.db |
asus_client_roam_timestamp | Gauge | host, mac, band | Last roam event time (unix) from wifi_detect.db |
The Grafana Dashboard
The included dashboard (importable JSON in grafana/asus-zenwifi-xt9.json) gives a full overview of mesh health: per-node system stats, backhaul throughput, channel utilisation by band, and per-client RSSI / traffic tables.
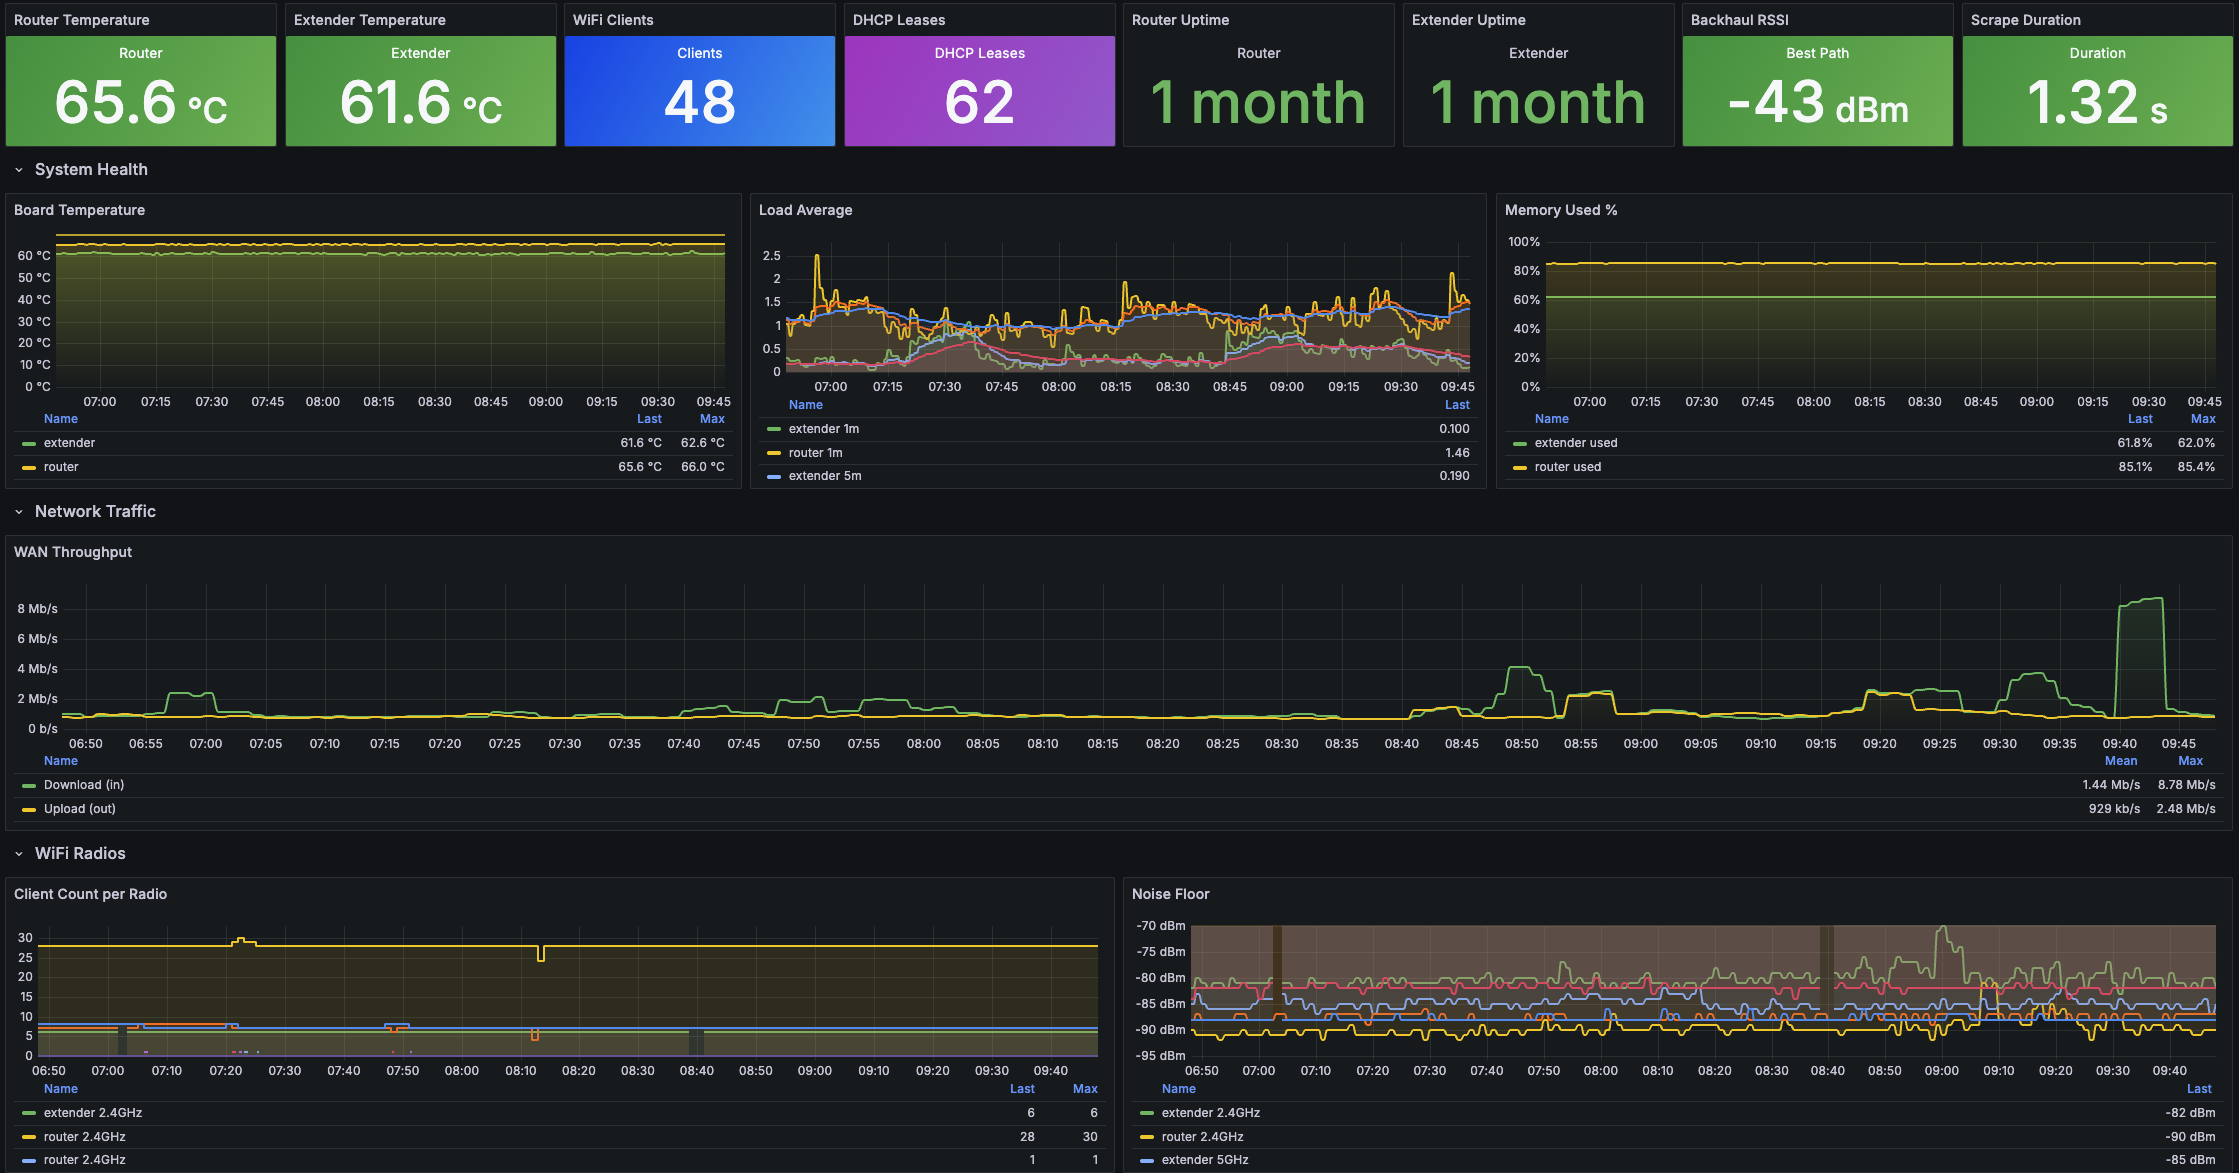
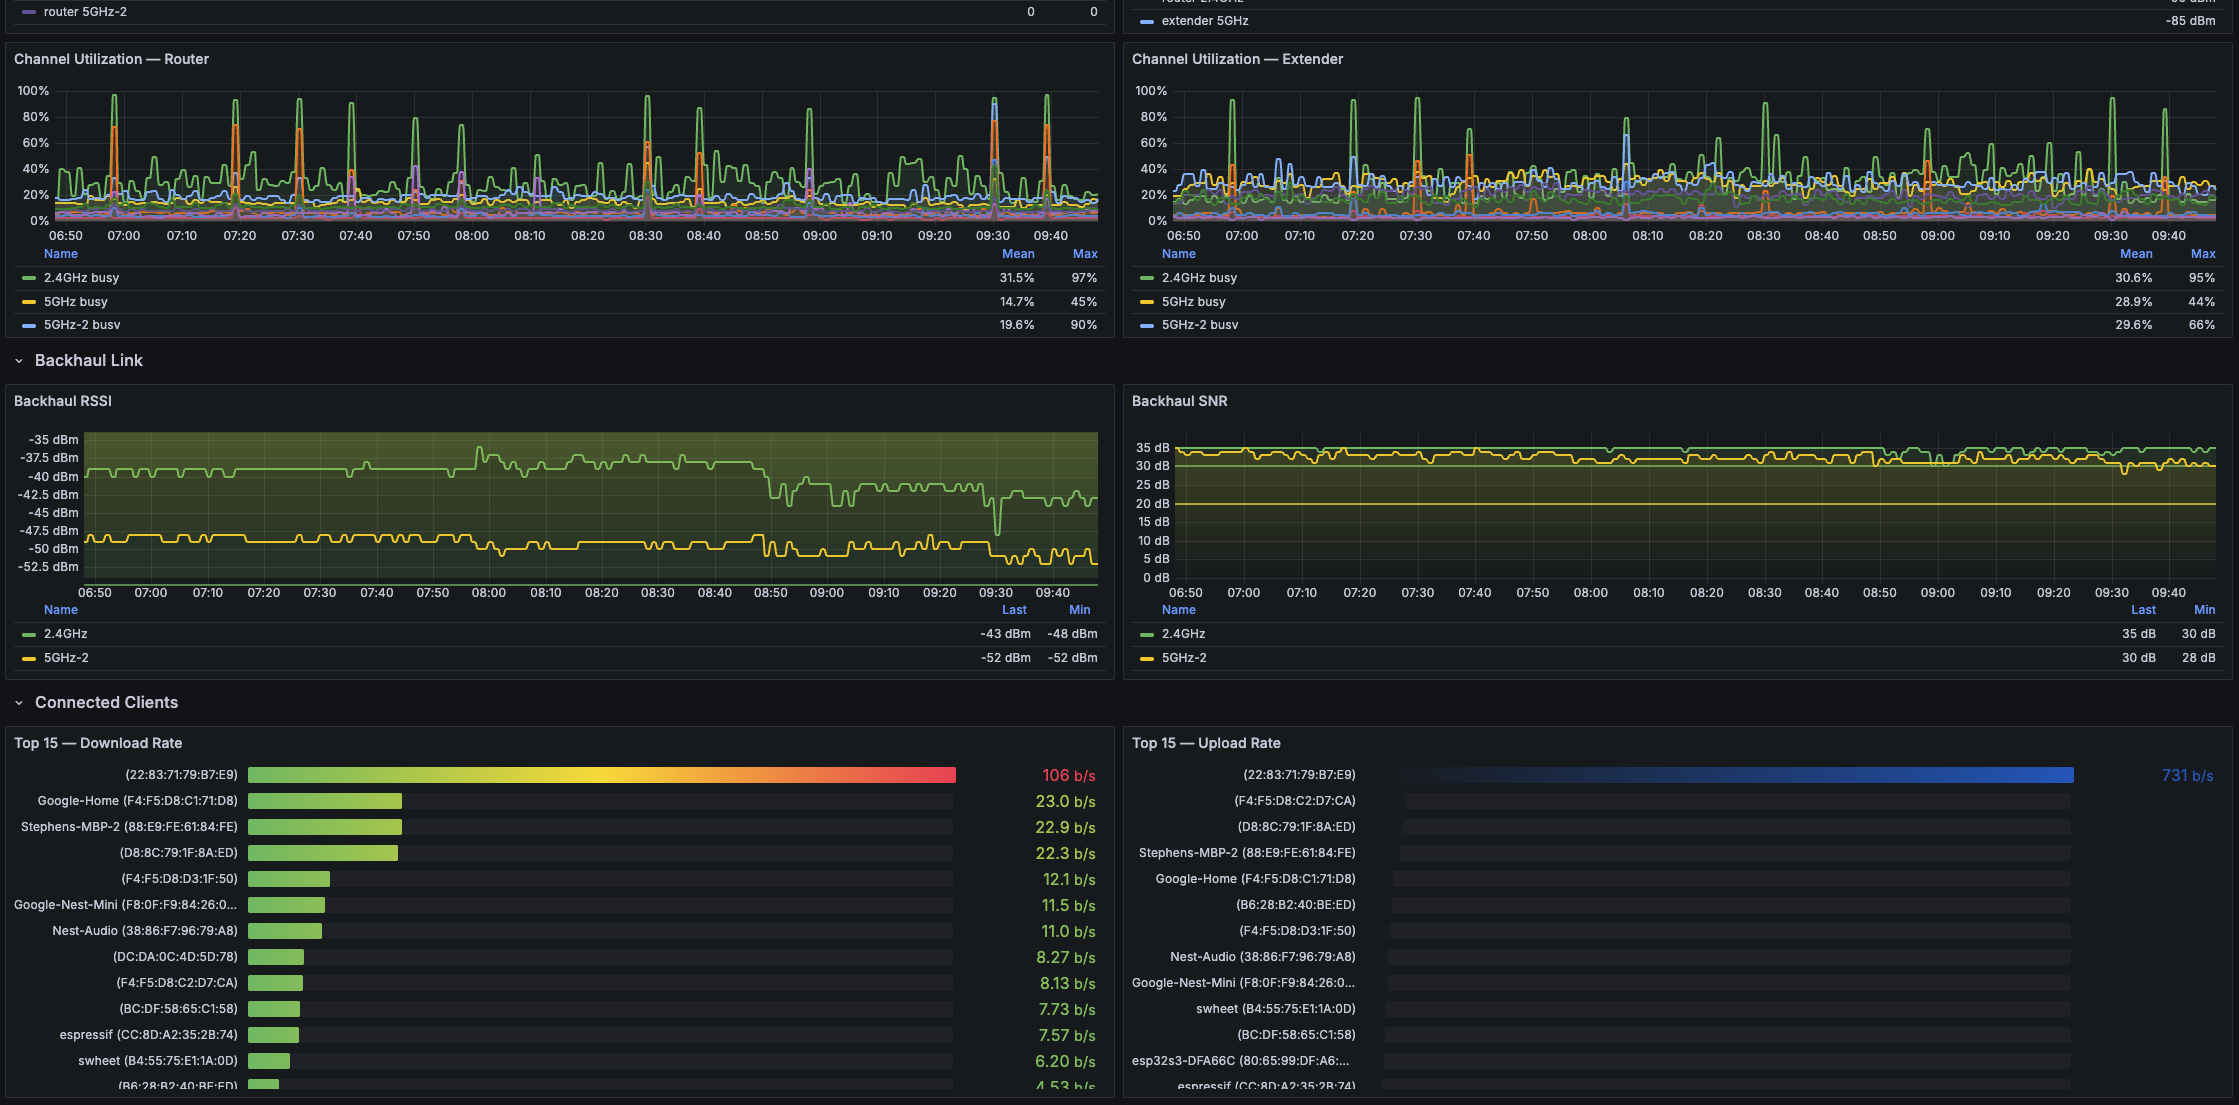
Grafana: Mesh Overview Panel
System stats, backhaul throughput, channel utilisation
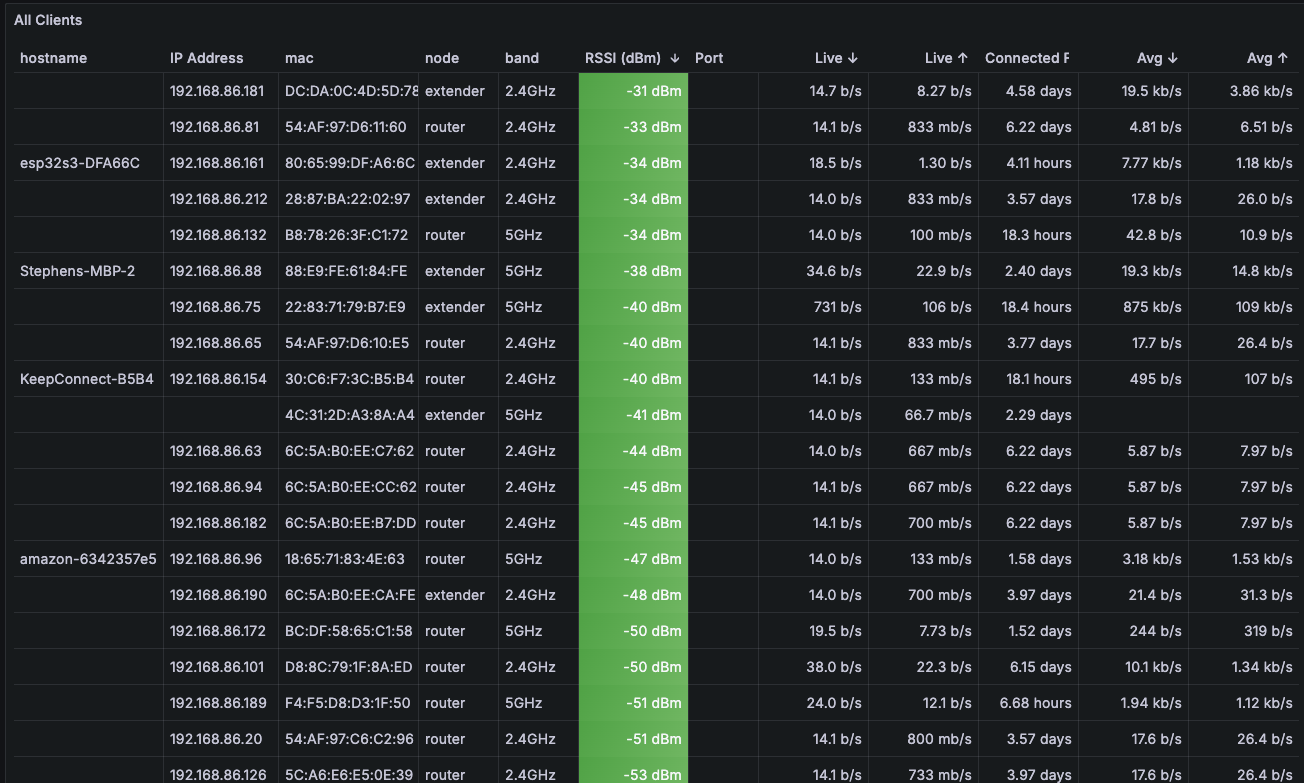
Grafana: Per-Client Table
RSSI, TX rate, roam events, traffic totals by MAC
Kubernetes Deployment
The manifests in k8s/ deploy the exporter into a Kubernetes cluster alongside a ServiceMonitor for Prometheus Operator autodiscovery:
k8s/
├── namespace.yml
├── configmap.yml.template    # ROUTER_HOST, EXTENDER_HOSTS, iface config
├── secret.yml.template       # SSH username + password
├── deployment.yml            # single-replica Deployment
├── service.yml               # ClusterIP on :8000
└── servicemonitor.yml        # Prometheus Operator scrape config
Copy the .template files, fill in your router's IP and SSH credentials, and apply:
kubectl apply -f k8s/namespace.yml
kubectl apply -f k8s/configmap.yml
kubectl apply -f k8s/secret.yml
kubectl apply -f k8s/deployment.yml
kubectl apply -f k8s/service.yml
kubectl apply -f k8s/servicemonitor.yml
The SSH password goes in a Kubernetes Secret. If you want keys instead of passwords, swap the SSHClient init to use pkey — Paramiko supports it.
Getting It Running
Prerequisites: SSH enabled on the ASUS router (in the web UI under Administration → System → SSH Daemon), and sqlite3 available on the router (it is on stock AiMesh firmware).
Local dev:
git clone https://github.com/swheat/asuszenwifixt9-monitoring
cd asuszenwifixt9-monitoring
pip install -r requirements.txt
export ROUTER_HOST=192.168.50.1
export ROUTER_SSH_USER=admin
export ROUTER_SSH_PASSWORD=yourpassword
python3 -m collector.main
Then hit http://localhost:8000 — you should see raw Prometheus text output within a few seconds of the first scrape.
The code is on GitHub. If you're running a different ASUS AiMesh model and the interface names or DB paths differ, the config is all in collector/config.py — change ROUTER_WIFI_IFACES and the DB paths to match your firmware.